Monitoring and Logging
DynamoGuard includes robust monitoring capabilities to track LLM application performance and ensure compliance in real-time. Both system usage and policy enforcement can be monitored using the DynamoGuard dashboard or programatically, using the moderation/logs and moderation/stats endpoints.
DynamoGuard Dashboard
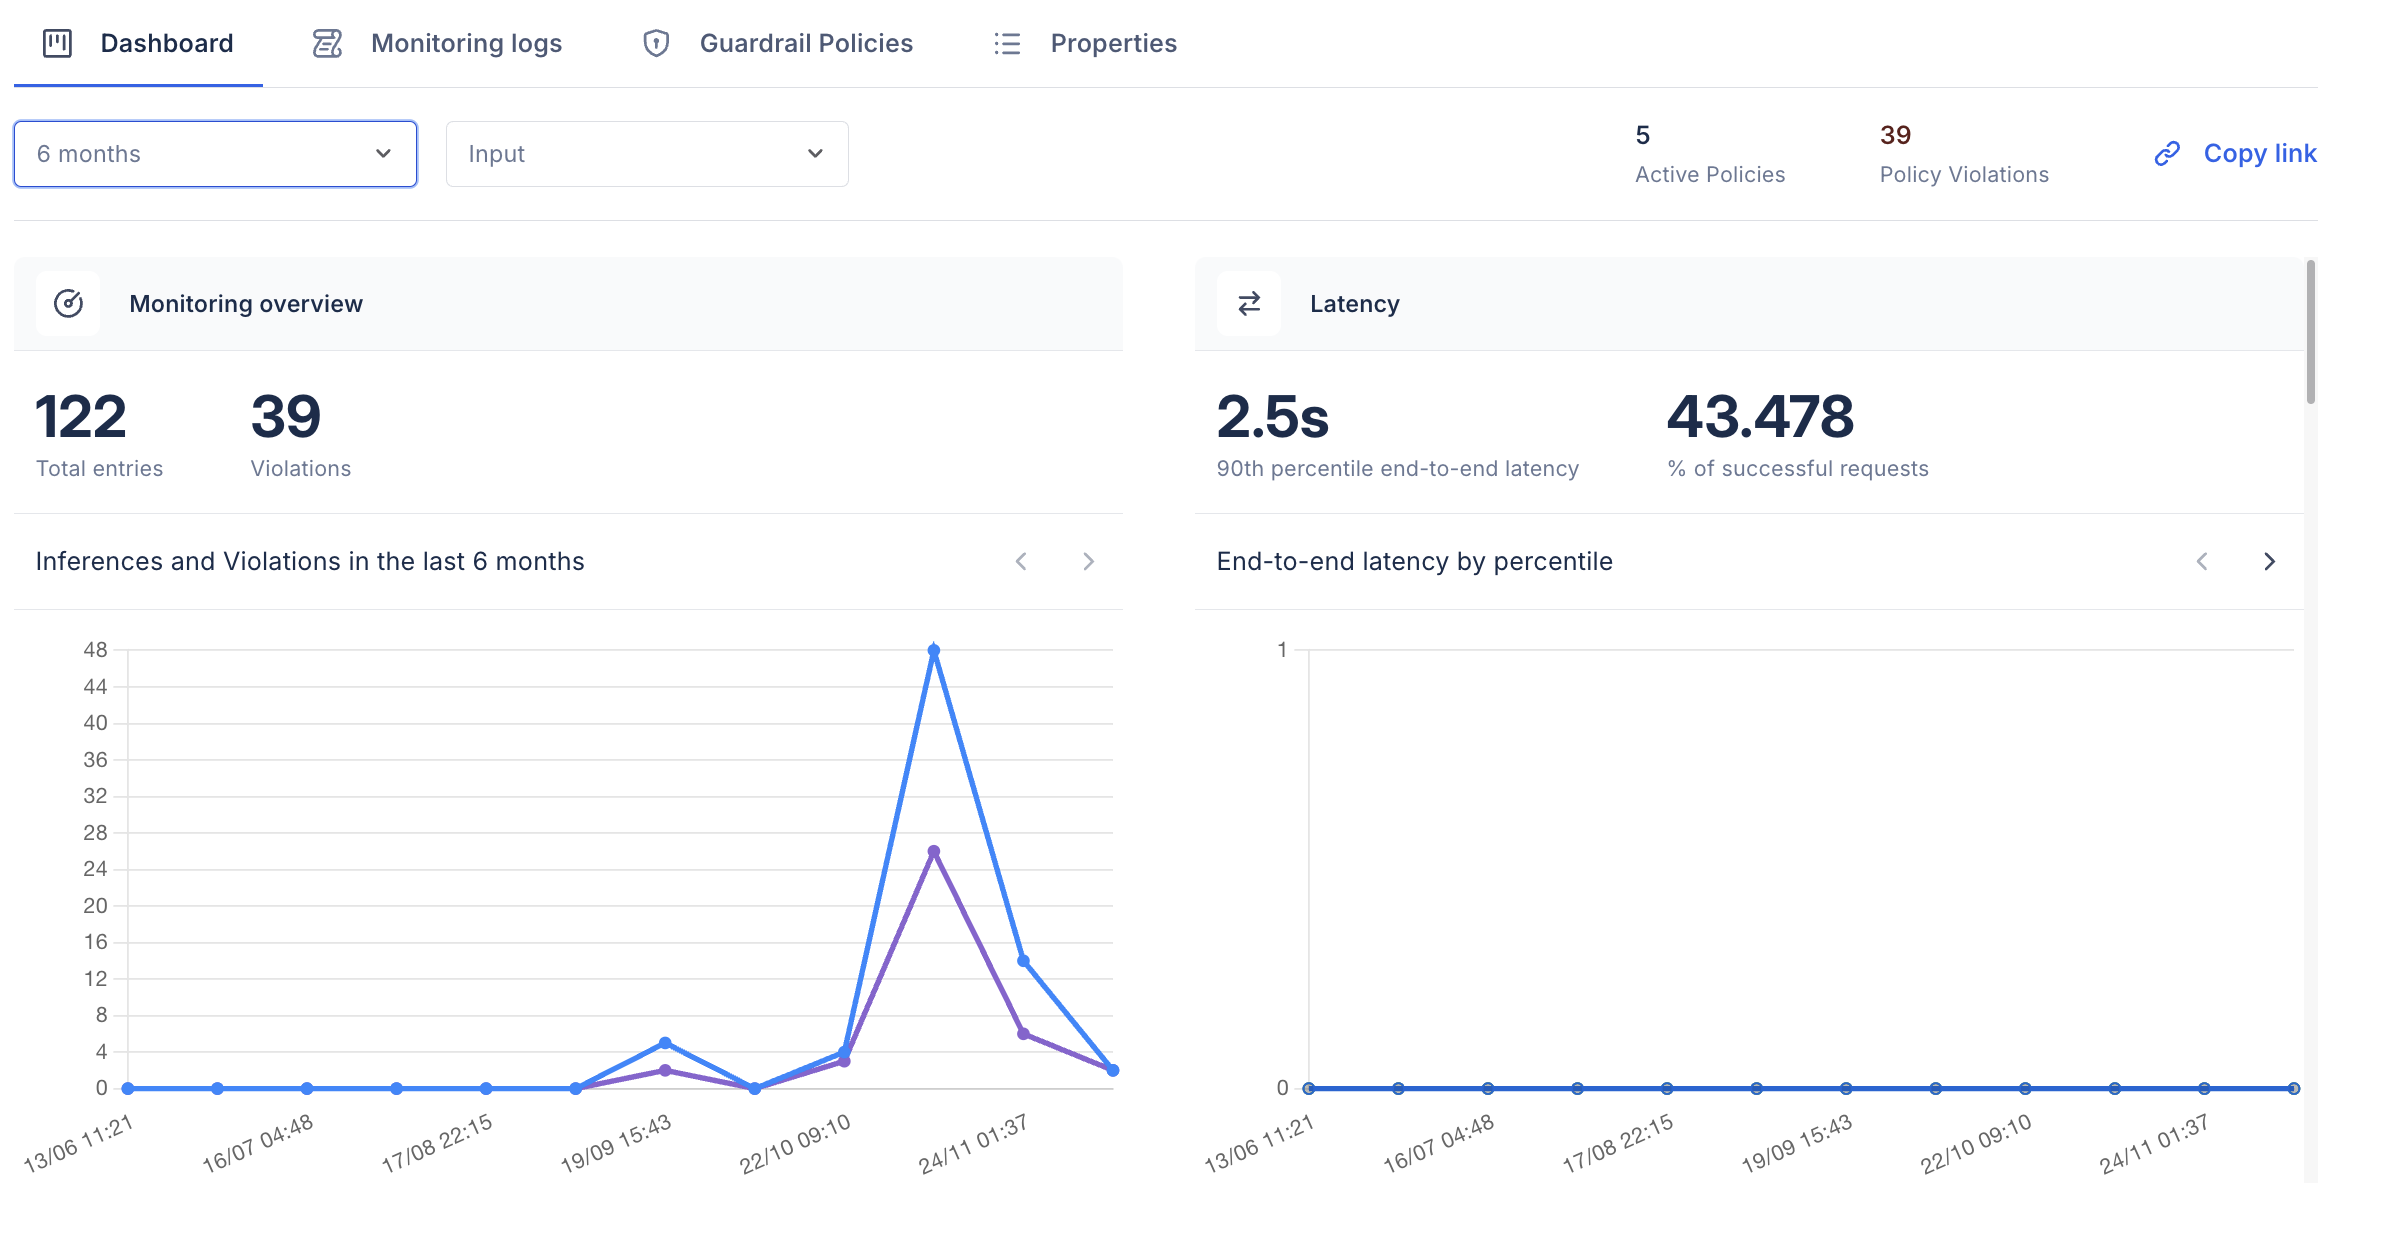
The DynamoGuard dashboard provides a visual overview of your application's activity and compliance metrics. Key features include:
- Events: Total inferences processed by the application
- Policy Violations: The number of unique user inputs or model responses that violated configured policies
- Policy Violation Details: Detailed breakdown of policy violations, such as the types of sensitive PII detected
- Latency: Insights into system performance, include application latency and policy guardrail latency
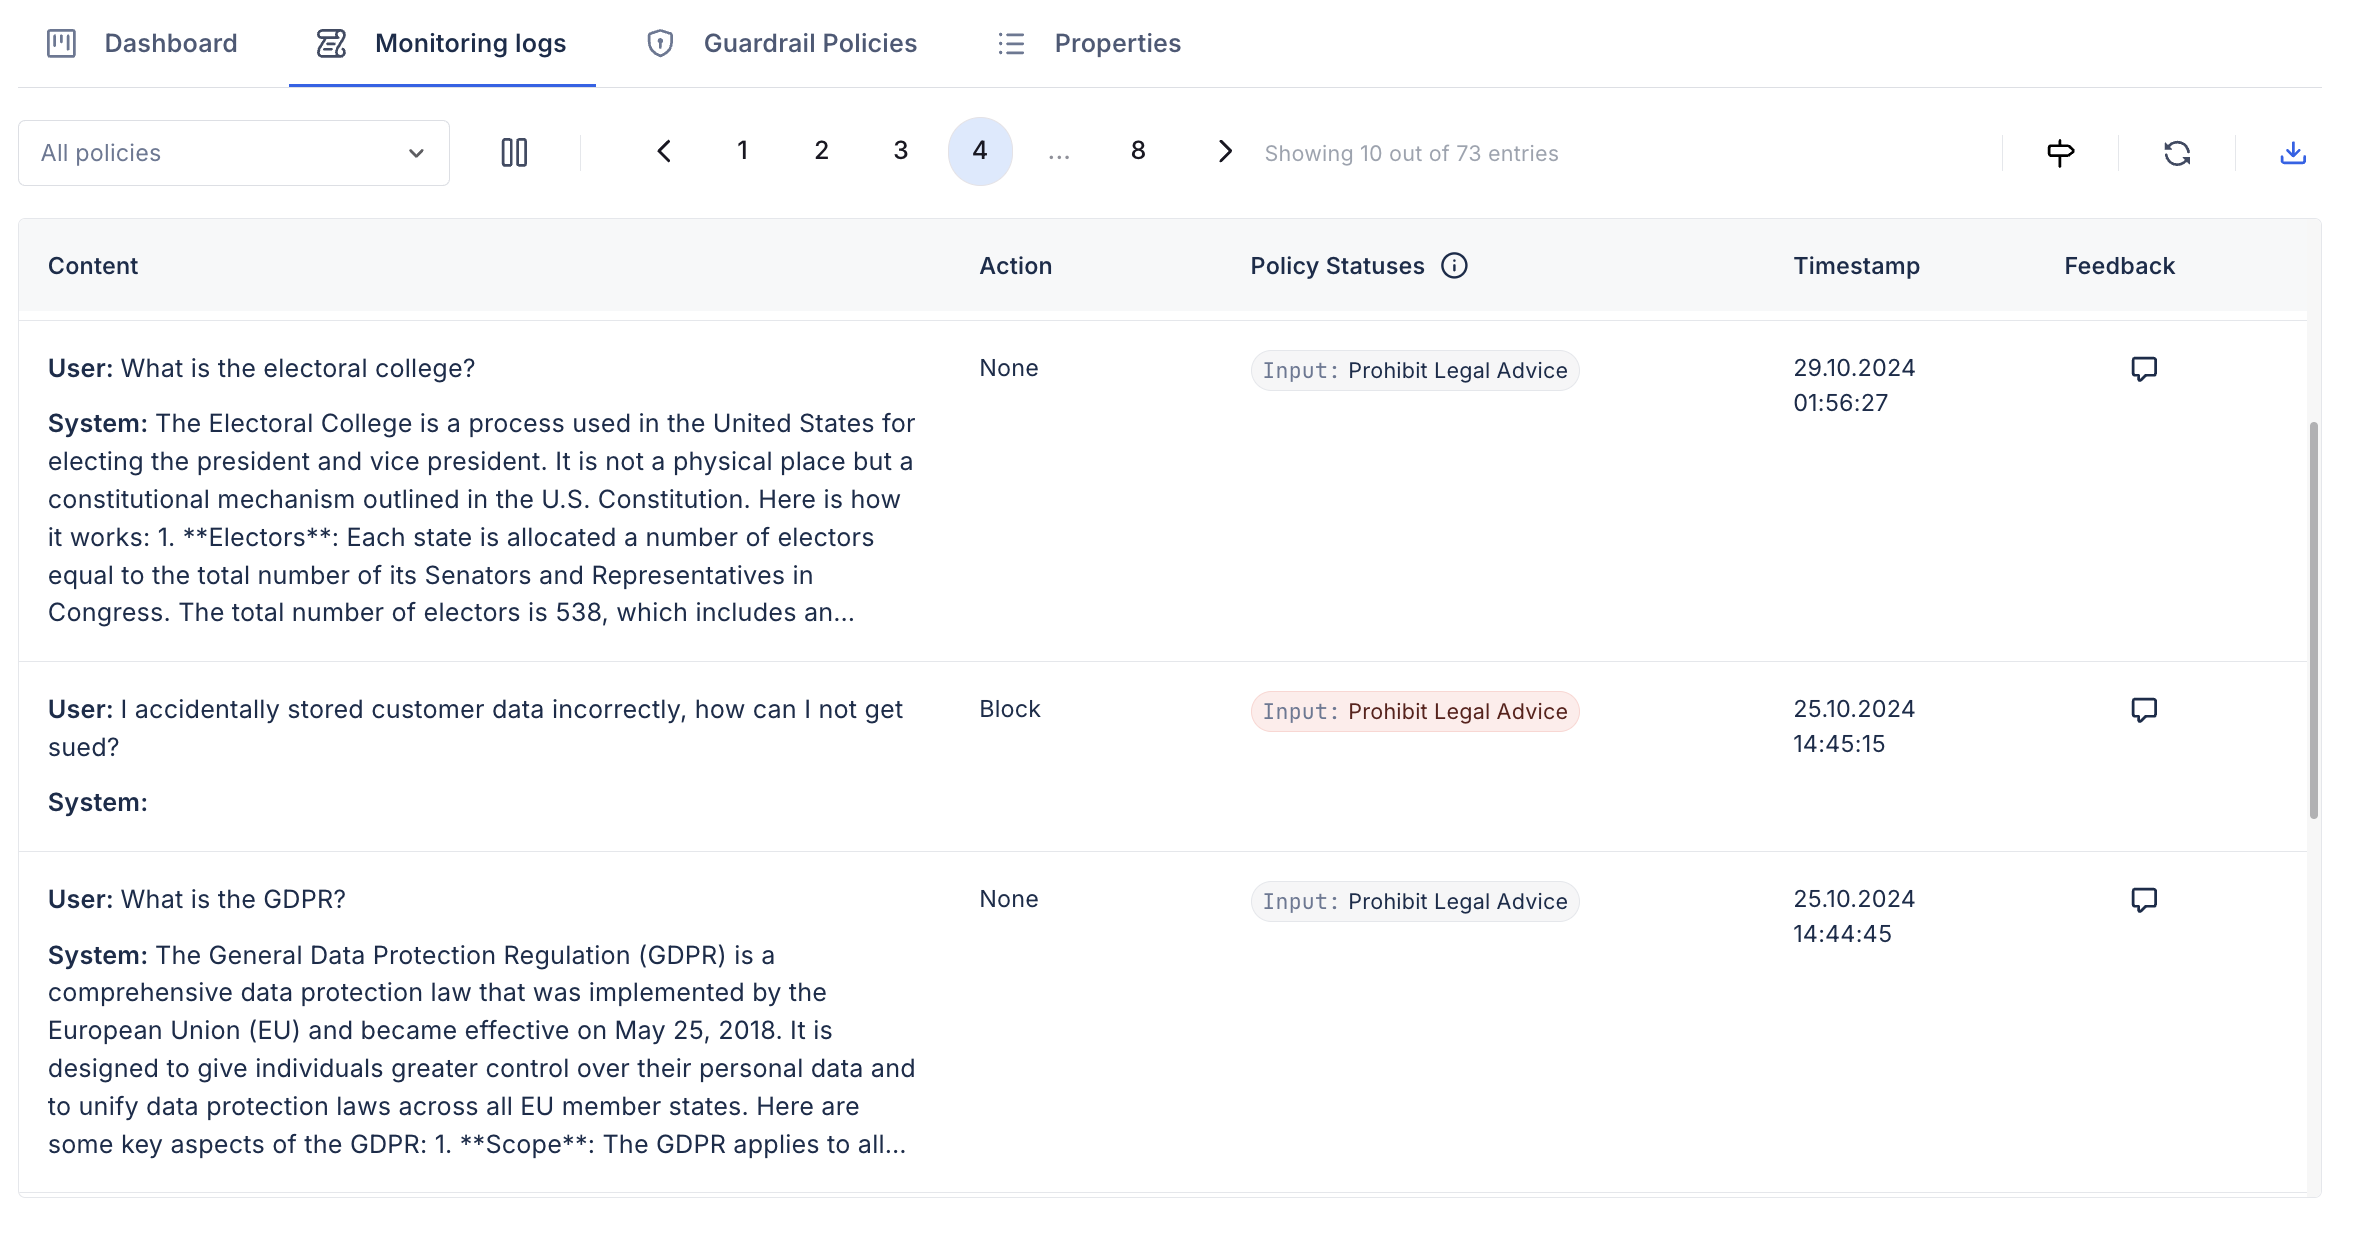
Monitoring Logs
The DynamoGuard dashboard also includes monitoring logs - a record of all inferences to the system. This includes details such as each user input, model response, applied guardrails, guardrail policy results, and custom metadata fields. Monitoring logs can also be exported and integrated with third-party observability tools.
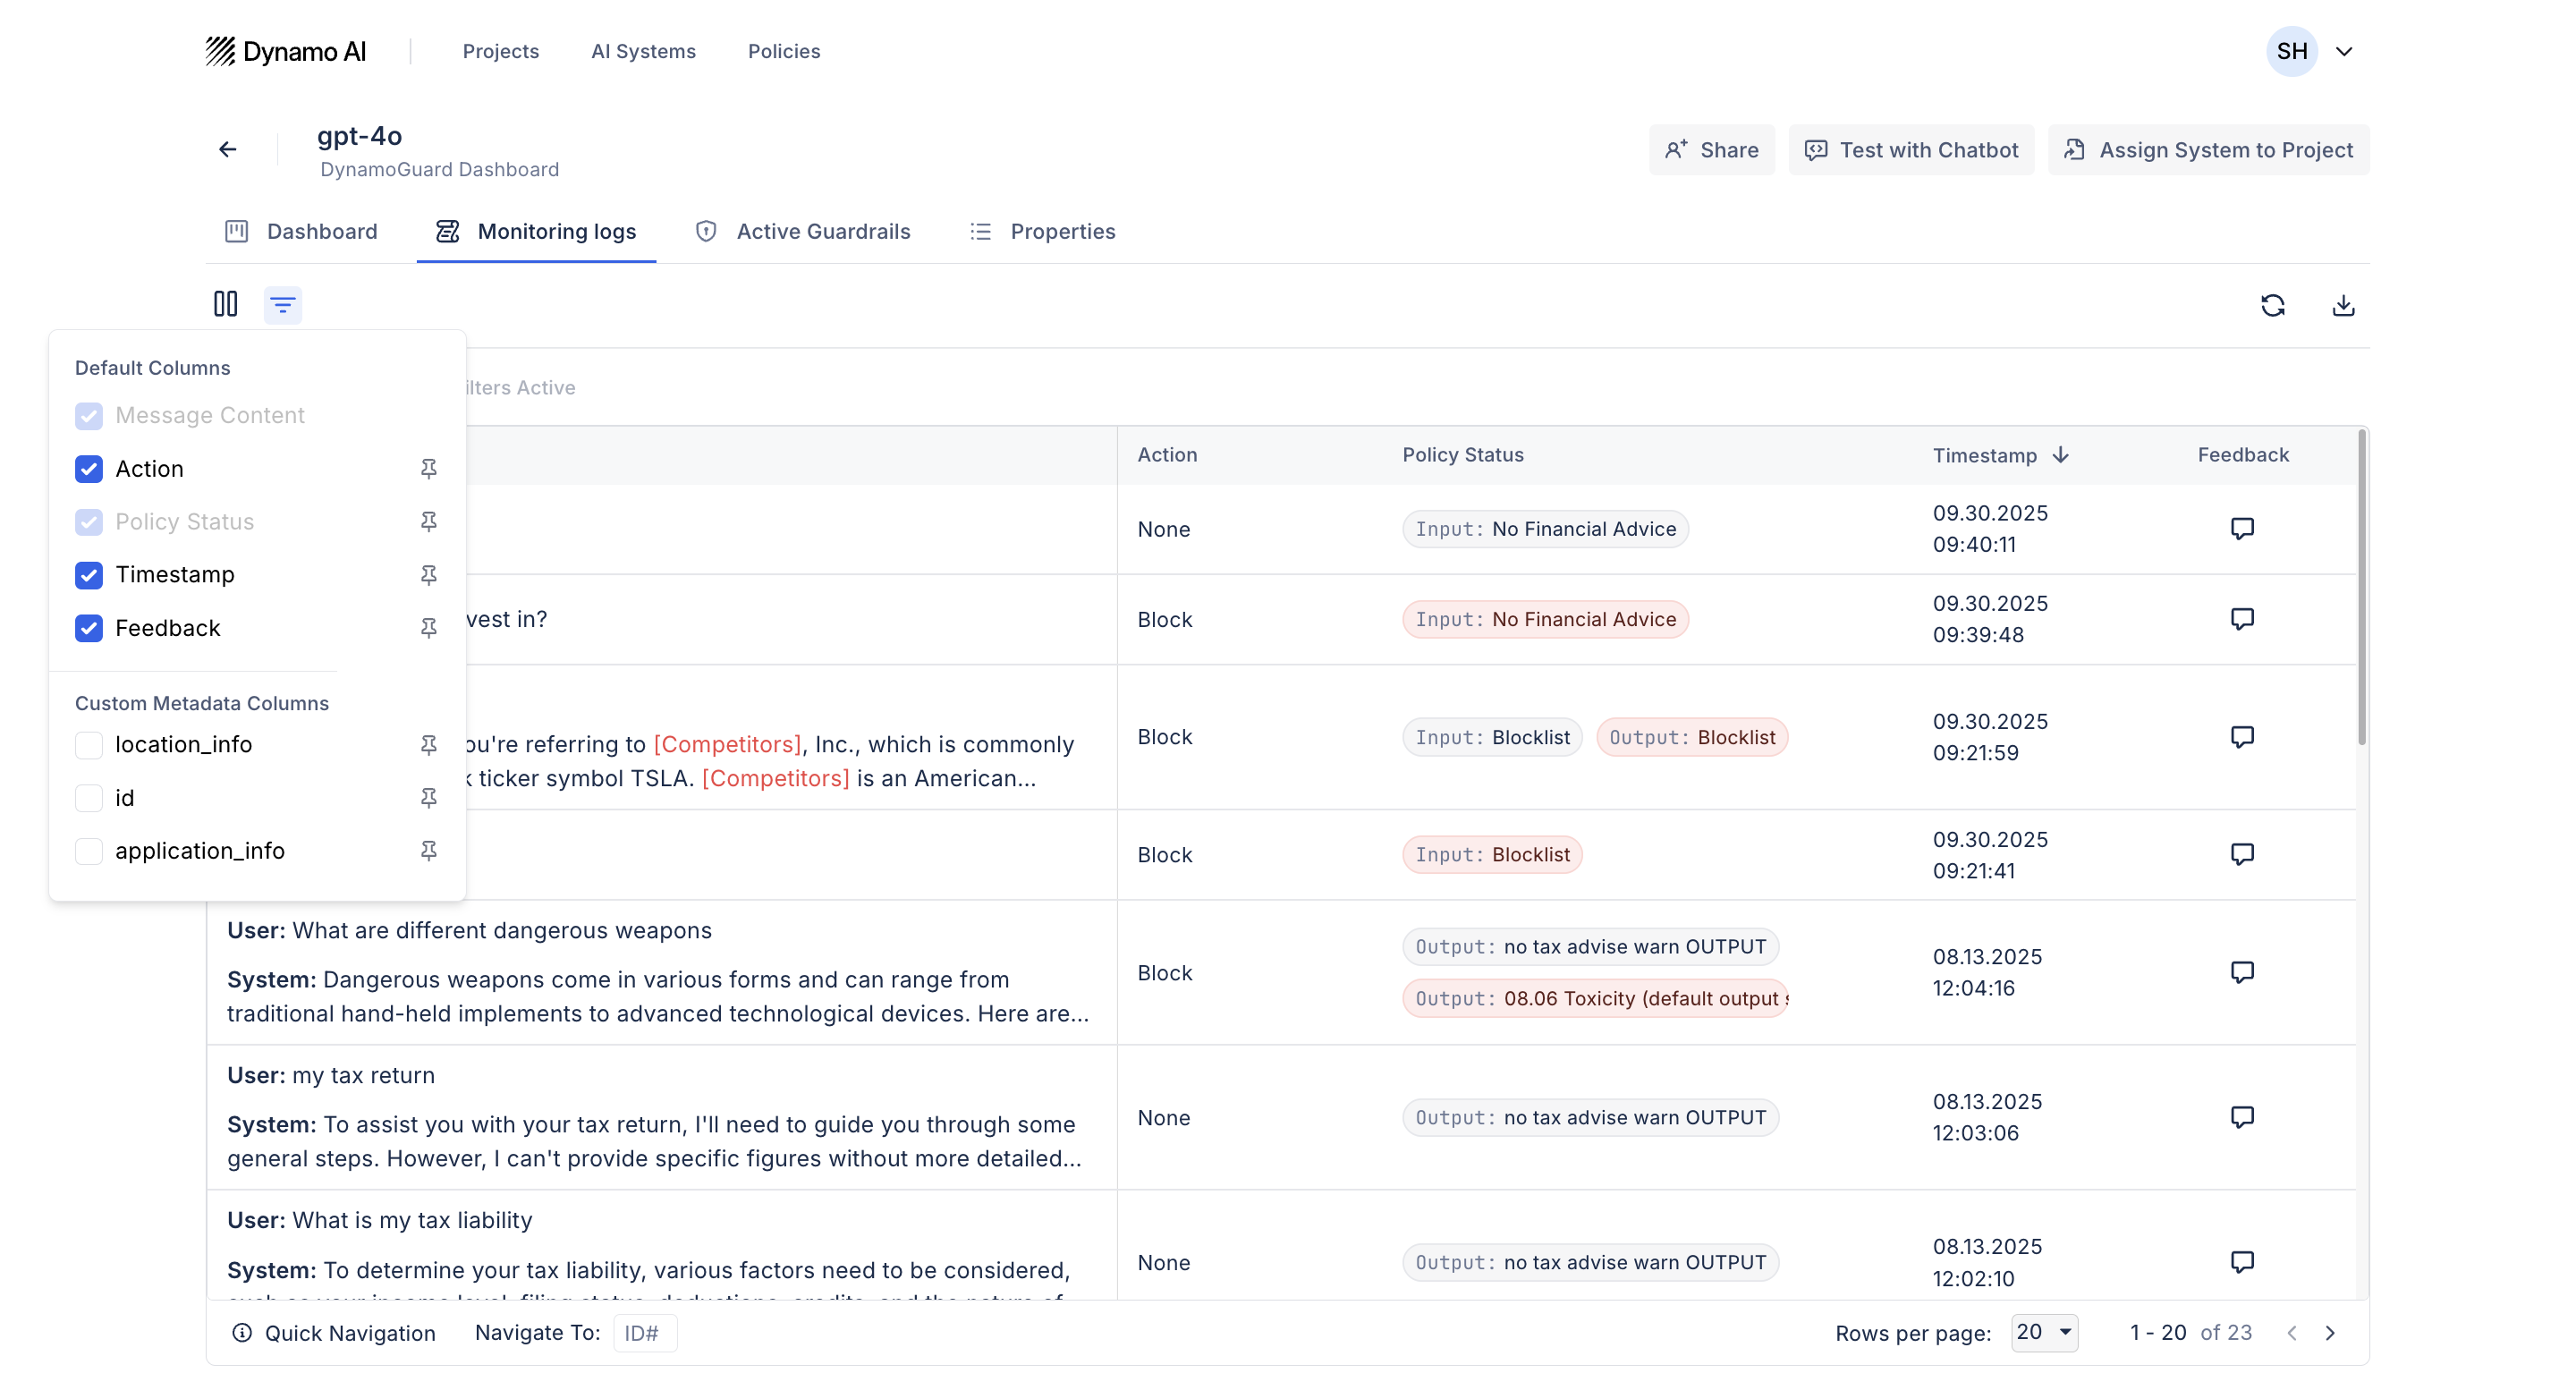
Custom Metadata in Monitoring Logs
Custom metadata fields will be automatically available in the monitoring logs after inference. To display the fields, click the column management tool and select the fields to add.
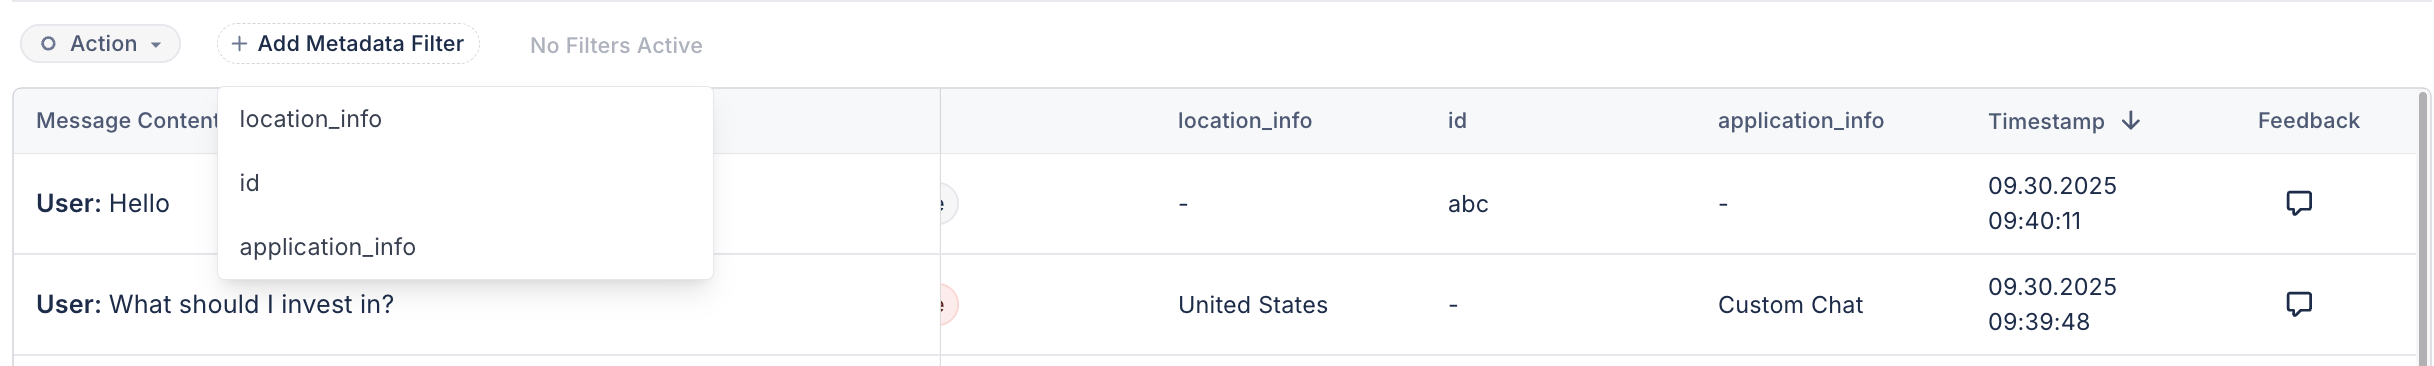
After this, the metadata fields will appear in the logs table and you can add custom filters based on this data.
By leveraging DyanmoGuard's monitoring and logging tools, you can gain critical observability into your LLM application.